Visualization Tools for Technical Writing
IMAGING AND DESIGN TOOLS FOR TECHNICAL WRITING


I started technical writing in 2020, and if there’s anything I struggled with the most, it was visualizing my ideas for easier communication. The more I wrote and researched, I found tools I could use to express myself better, and since I couldn’t find an article on visualization tools for technical writers, I thought it’d be nice if I wrote an all-encompassing article on visualization tools for technical writing.
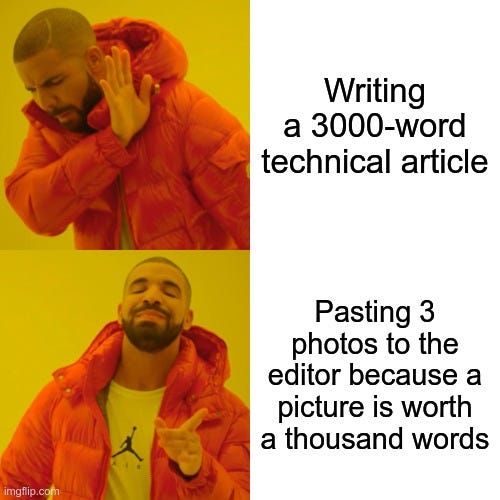
It is well said that a picture is worth a thousand words. Adding visuals to your technical articles, documentation e.t.c, could help with the following…
- Retaining readers' attention.
- Better understanding.
- Communicating statistical data.
- Improved description.
In this publication, I overview various tools you could use to create images for enhanced communication in your technical write-ups.
Looking to get started with technical writing? Check these courses and blog out…
- Lumen Learning technical writing course.
- Google technical writing course.
- W3School.in technical writing course(Includes SEO tutorials).
- The University of Oxford style guide.
- Semrushblog SEO course.
- Study.com technical writing course.
- Paligo.net articles.
- Clickhelp technical writer guide.
DIAGRAMMING TOOLS
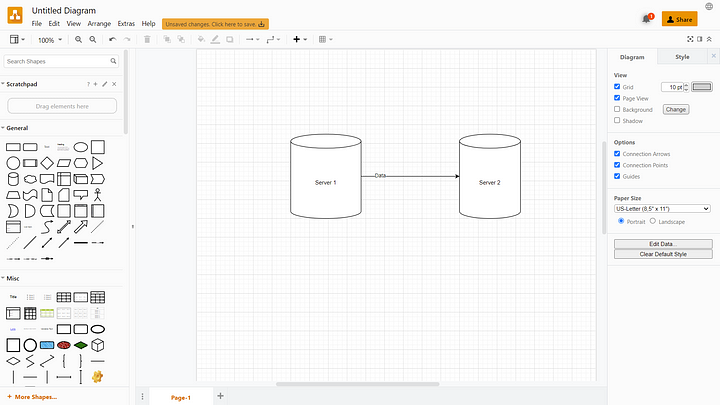
Diagramming tools help you create diagrams, flowcharts, and technical representations of your ideas.
Most diagramming tools have templates that technical writers could use to illustrate their ideas easily. e.g. creating a flow chart of how APIs work.
Examples of diagramming apps include;
- Draw.io.
- Microsoft Visio.
- Miro.
- Diagrams.app(for Mac only)
- Sketch.
- dbdiagrams
PRESENTATION TOOLS

Presentation tools are an easy way to share images in a slideshow. Presentation apps come in handy when creating documentation or technical tutorials e.t.c.
Some presentation apps include…
GRAPHIC DESIGN TOOLS
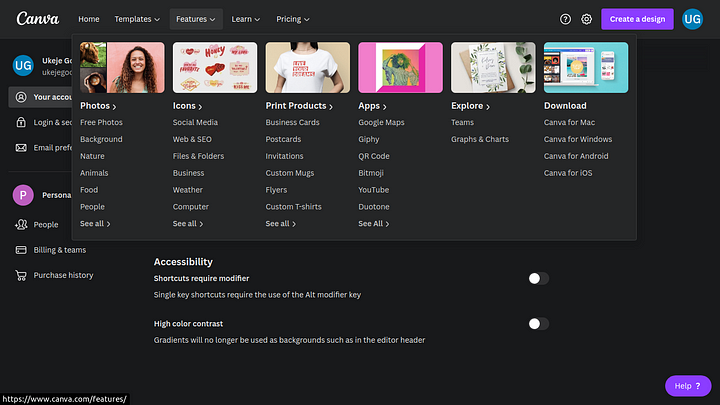
Good graphic designs draw the attention of readers to the subject and there are a lot of tools that aid with creating awesome graphics.
These tools include…
- Adobe Photoshop.
- Canva.
- Google Snapseed(Android & iOS).
- Corel Draw.
- Desygner.
- Pixlr.
DATA VISUALIZATION AND CHARTING TOOLS
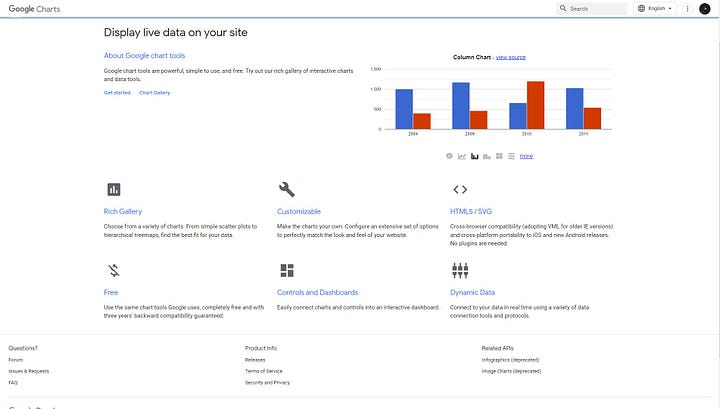
Data and statistics are better visualized as they help readers pull insight from the specified data.
The following are data visualization and charting tools…
SCREENSHOT AND SCREEN RECORDING TOOLS
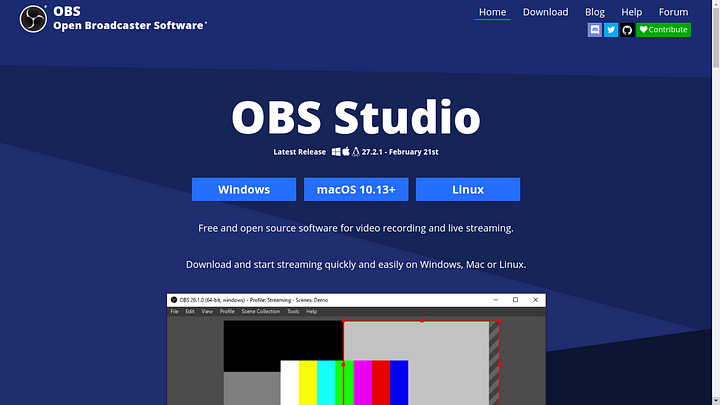
Most of the time when creating tutorials, you might need to visualize the steps as they happen.
The following screenshots and screen recorders are available to choose from…
- Bandicam.
- OBS studio.
- Kazam(Linux).
- URL2PNG.
- Windows snipping tool e.t.c
CODE TO IMAGE TOOLS
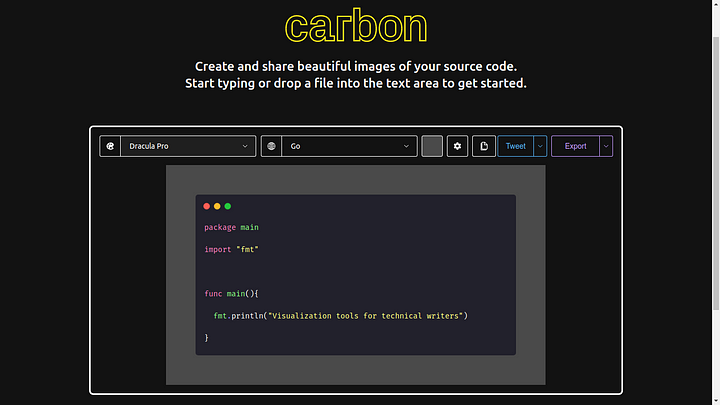
Code-to-image tools offer a way to easily share beautiful code snippets.
Useful websites in this category include…
ENGINEERING COMPUTER-AIDED DESIGN TOOLS(CAD)
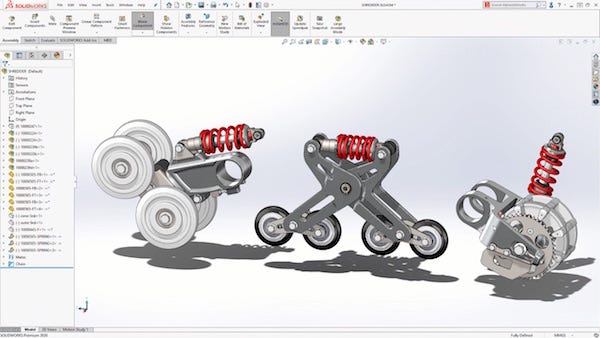
These computer-aided design software are mostly used in majors like Mechanical engineering, Civil engineering e.t.c.
Complex explanations can be made simple using them as they also have simulation features.
MEMES AND GIF TOOLS
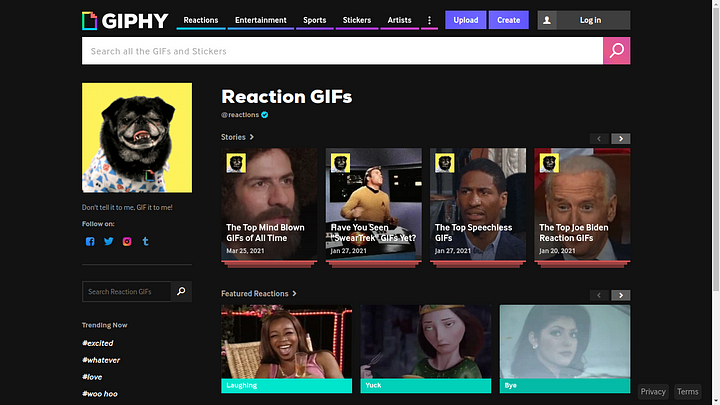
Technical content can be boring sometimes. A few memes and GIFs never go wrong.
Memes and GIFs should be used to depict expression only when necessary.
Useful tools for creating memes and GIFs are…
Technical writing visualization Tips
- Always add reference links to images, if any
- Add a caption to images
- Add alternate text to images to aid the visually impaired.
- Use only images that describe a context in the subject.
- Always add descriptions to charts.
- Label all diagrams.
This article from Lumen Learning contains guidelines on how visuals should be used in technical writing…
[Technical Writing*You build your communications out of visual elements: the dark marks of your words, sentences, and paragraphs against…*courses.lumenlearning.com](https://courses.lumenlearning.com/technicalwriting/chapter/general-design-concepts/)
Till the next publication, it is.
You can check out my profile